Green Lights, False Confidence: How Ping-Based Uptime Monitoring Deceives the Teams That Trust It Most
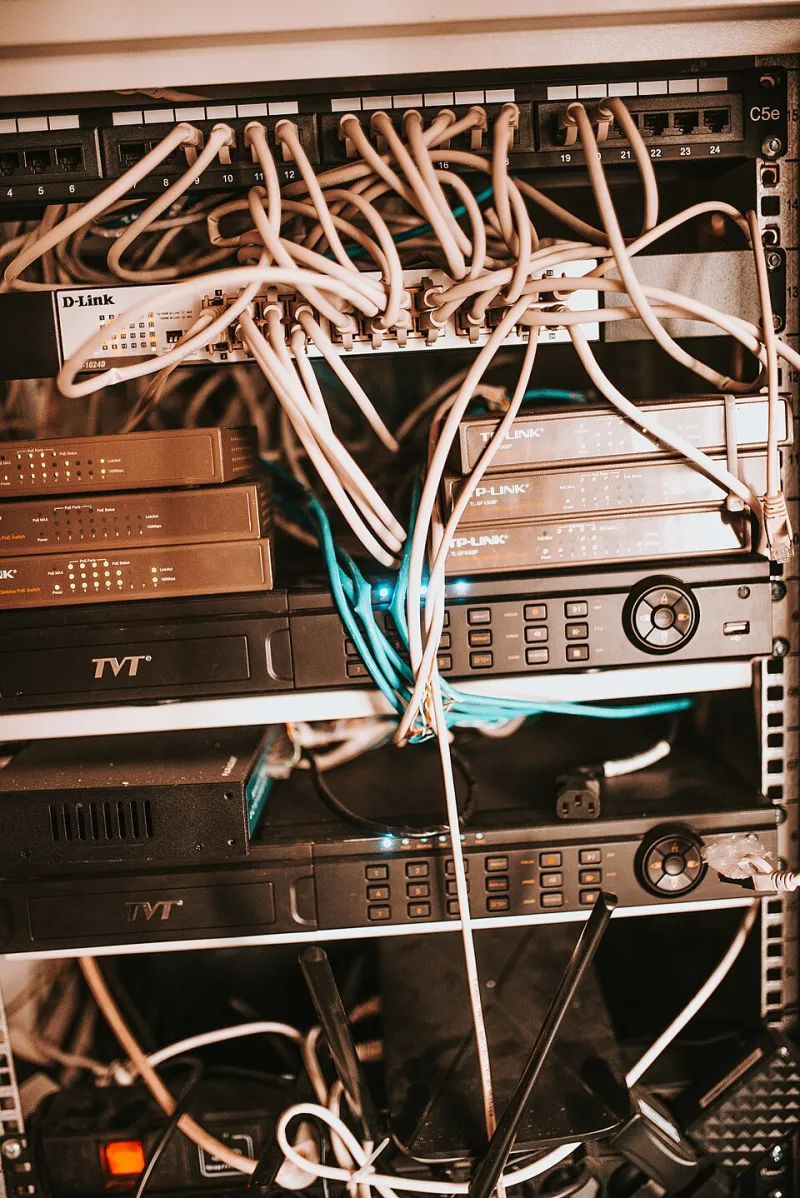
Photo: server monitoring dashboard false positive network infrastructure, via csijax.com
There is a particular kind of organizational blindness that develops slowly, almost imperceptibly, inside engineering teams that have learned to trust their uptime dashboards. The numbers look solid. The response times appear acceptable. The status page glows with reassuring greens. And then, without warning, a customer support inbox fills with complaints that the system has been quietly misbehaving for hours — sometimes days.
This is not a story about infrastructure failure in the traditional sense. The servers did not go down. The database did not crash. What failed was the monitoring layer itself: the synthetic ping infrastructure that teams depend upon to tell them whether their bulk communication pipelines are actually functioning. Understanding why this happens — and how pervasively it affects production systems — is one of the more consequential conversations a development team can have.
What Synthetic Pings Are Actually Measuring
At their most fundamental level, ping-based health checks confirm one thing: that a particular endpoint responded to a particular request within a defined window of time. That is a meaningful data point. It is not, however, a complete picture of system health.
Consider a bulk SMS notification pipeline. A synthetic ping directed at the API gateway might return a 200 status code in 180 milliseconds — a perfectly acceptable result by almost any standard threshold. What that ping does not reveal is whether the message queue sitting behind that gateway is backed up by forty thousand unprocessed jobs. It does not reveal whether the carrier routing layer is silently dropping a percentage of outbound traffic. It does not reveal whether downstream delivery confirmation webhooks have stopped firing, leaving your system operating under the assumption that messages are being delivered when they are not.
The ping confirmed that the front door opened. It said nothing about what was happening inside the house.
The Geographic Illusion
The placement of monitoring probes introduces a second, equally significant distortion. Most teams configure their health checks to run from infrastructure that is geographically and topologically close to the systems being monitored. A probe running inside the same AWS region as your application will almost always see better latency and higher reliability than the end users and downstream systems that interact with your platform from the broader internet.
For bulk communication infrastructure specifically, this matters enormously. A message origination server might respond flawlessly to a probe originating from within the same data center while simultaneously struggling to establish stable connections with carrier aggregators located in different network regions. The probe never sees that struggle. It never could — it was never positioned to observe it.
This is not a hypothetical edge case. It is a structural limitation of how most synthetic monitoring is deployed, and it creates systematic blind spots precisely where bulk messaging pipelines are most vulnerable: at the handoff points between your infrastructure and the external networks responsible for final delivery.
Interval Blindness and the Gaps Between Checks
Most production monitoring systems run health checks on intervals ranging from thirty seconds to five minutes. This cadence feels frequent until you consider the failure modes that can emerge and resolve — or emerge and persist invisibly — within those windows.
A bulk notification system processing time-sensitive alerts, such as fraud warnings or two-factor authentication codes, can experience meaningful degradation in the span of ninety seconds. A carrier throttling event, a momentary queue saturation, a DNS resolution anomaly — these incidents can affect thousands of outbound messages before the next scheduled ping fires. If the system recovers before the probe runs, the event never appears in your monitoring record. If the system partially recovers — maintaining enough surface function to pass the health check while still processing at degraded capacity — the incident remains invisible indefinitely.
Engineers sometimes call this interval blindness. It is one of the primary reasons that post-incident reviews so frequently surface a disconcerting gap between when customer impact began and when the monitoring system registered any anomaly.
What Legitimate Reliability Measurement Requires
Addressing these limitations does not require abandoning ping-based monitoring. It requires expanding the definition of what monitoring is supposed to accomplish.
For bulk communication infrastructure, meaningful reliability measurement should incorporate several layers that synthetic pings alone cannot provide. End-to-end transaction monitoring — which follows a test message through the full pipeline including carrier handoff and delivery confirmation — provides visibility into failure modes that endpoint checks structurally cannot detect. Monitoring the depth and processing rate of message queues reveals capacity degradation before it becomes a customer-facing problem. Tracking delivery confirmation latency distributions, rather than simple pass/fail delivery status, surfaces the gradual slowdowns that precede outright failures.
Geographic distribution of monitoring probes matters as well. Probes positioned outside your primary infrastructure — running from commercial monitoring networks that simulate external traffic patterns — will encounter a meaningfully different version of your system than internal probes do. That difference is informative. It represents what your actual users and downstream partners experience.
The Organizational Dimension
There is a cultural component to this problem that deserves direct acknowledgment. Green dashboards create organizational comfort, and organizational comfort reduces the urgency of investing in deeper observability. Teams that have never experienced a significant gap between their monitoring picture and their actual system state tend to underestimate how wide that gap can become.
The cost of this underestimation is not evenly distributed. It concentrates at the moments when bulk communication infrastructure is under the most pressure — high-volume campaign sends, peak notification periods, promotional windows — precisely the circumstances in which degraded delivery has the highest business impact. A monitoring system that performs adequately under normal load while providing false reassurance under stress is not a safety net. It is a liability dressed in the appearance of one.
Building Toward Honest Observability
The practical path forward involves treating uptime measurement as a multi-signal discipline rather than a single-metric verdict. Response time at the endpoint is one signal. Queue depth is another. Delivery rate against expected volume is another. Carrier acknowledgment latency is another. None of these signals alone constitutes a complete picture. Together, correlated and trended over time, they begin to approximate one.
For development teams operating bulk communication pipelines at any meaningful scale, the question worth sitting with is not whether the dashboard shows green. The question is whether the monitoring system is positioned to detect the specific failure modes that would actually harm users — and whether it would detect them before the support queue does.
The answer, for most teams relying primarily on synthetic pings, is more uncomfortable than the dashboard suggests.