Chasing Alerts Into the Abyss: How Reactive Network Monitoring Keeps Your Team Busy and Your Systems Broken

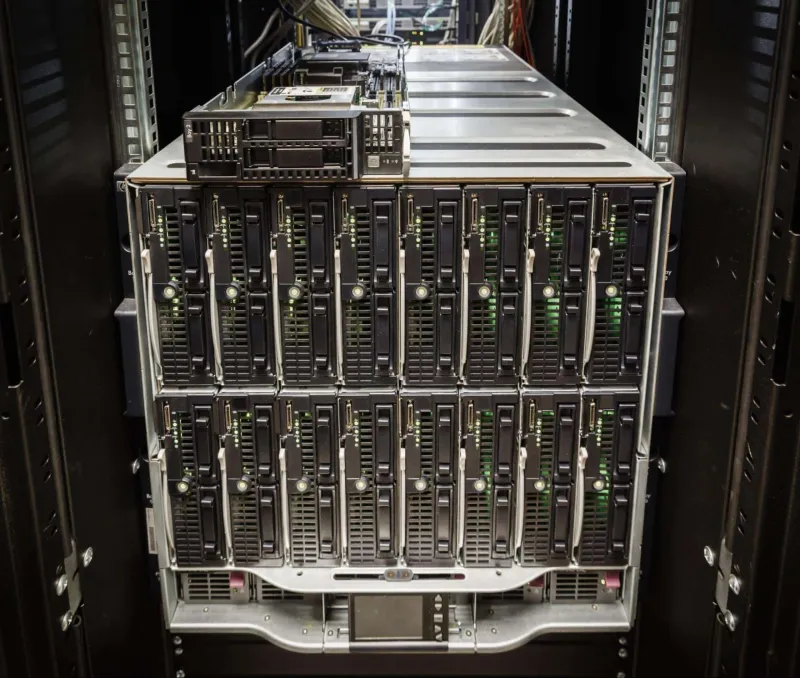
Photo: NASA Goddard Space Flight Center, CC BY 2.0, via Wikimedia Commons
There is a particular kind of exhaustion that network engineers recognize immediately: the kind that comes not from solving hard problems, but from solving the same soft problems, over and over, in perpetuity. An alert fires. The team scrambles. The metric recovers. Everyone exhales. Two weeks later, the cycle begins again.
This is not monitoring. This is managed chaos — and it is far more common than most engineering organizations care to admit.
The core issue is architectural, not operational. When monitoring infrastructure is designed primarily to detect and report symptoms, the organization becomes structurally dependent on human reaction as its primary defense mechanism. Ping responses, packet loss percentages, and latency spikes are valuable data points. But when they serve as the entire foundation of a network health strategy, they create a system that is, by design, always one step behind the actual problem.
The Anatomy of a Reaction Loop
Consider a typical scenario at a mid-sized SaaS company. Their monitoring stack sends alerts when round-trip ping times to a critical API gateway exceed a defined threshold. The on-call engineer investigates, finds elevated congestion on a specific network segment, restarts a service or adjusts routing, and the numbers normalize. Ticket closed.
What rarely gets documented is what preceded the congestion. Was there a gradual increase in connection pool exhaustion over the prior 72 hours? Did a configuration change three days earlier introduce a subtle inefficiency in how traffic was being distributed? Is this the fourth time this particular segment has been the site of an incident in the past quarter?
Reactive monitoring, by definition, captures the moment of visible distress. It does not capture the long arc of systemic deterioration that made distress inevitable. Every alert that gets resolved without root cause analysis is a debt payment on a loan the team does not know they took out.
Why Ping Metrics Are Seductive and Insufficient
Ping-based monitoring persists because it is accessible, inexpensive, and immediately interpretable. A rising number is bad. A falling number is good. The simplicity is genuinely useful — but it is also the source of its greatest limitation.
Network latency is a lagging indicator. By the time a ping metric degrades to the point of triggering an alert, the conditions that caused that degradation have typically been building for some time. Depending on the architecture, those conditions may include resource saturation, routing inefficiencies, upstream provider instability, or application-layer behavior that is placing unexpected demands on the network fabric.
None of those root causes are visible in a ping graph. What is visible is the consequence — a number that crossed a threshold. The metric is accurate. The diagnostic value is limited.
For teams operating bulk communication infrastructure — systems that depend on consistent, high-throughput delivery of messages, notifications, or API calls at scale — this distinction is not academic. When a bulk messaging pipeline degrades, the latency spike is the last thing that happens, not the first. By the time the alert fires, messages may already be queuing, retrying, or failing silently.
The Teams That Stopped Chasing and Started Designing
Several engineering organizations have made the transition from reactive to proactive network health strategies, and the pattern of change is remarkably consistent across industries.
One infrastructure team at a logistics technology company spent the better part of two years responding to intermittent delivery failures in their notification pipeline. Their monitoring was thorough by conventional standards: ping checks running at 60-second intervals, latency dashboards with historical trending, and an on-call rotation that ensured human eyes on every alert within minutes.
The failures kept happening. The alerts kept firing. The team kept responding.
The shift came when leadership mandated a structured post-incident review process that required identifying not just what failed, but what conditions made failure possible. Within three review cycles, a pattern emerged: the failures clustered around peak traffic windows, but the underlying cause was a connection timeout configuration that had never been tuned for the actual traffic profile the system was handling. The ping metrics looked normal right up until they didn't — because the real problem lived at the application layer, invisible to network-level monitoring.
The fix was not a better alert. It was a configuration change that had been deferred for over a year because no one had connected it to the symptom pattern.
Building Monitoring That Looks Forward, Not Just Down
The practical shift from reactive to proactive monitoring involves several distinct changes in how teams instrument and interpret their infrastructure.
Instrument the application layer, not just the network layer. Connection pool utilization, queue depth, retry rates, and error classification data provide leading indicators that precede network-level degradation. If your monitoring stack cannot see these signals, it cannot warn you before the ping metric moves.
Establish baselines over time, not just thresholds in isolation. A latency reading of 180ms means nothing without context. Is that normal for this time of day? Is it trending upward over the past week? Threshold-only alerting ignores trajectory, which is where early warning signals actually live.
Treat recurring alerts as architectural evidence, not operational noise. When the same alert fires repeatedly, the correct response is not to acknowledge and close — it is to ask why the condition that triggers the alert keeps recurring. Recurring alerts are the infrastructure's way of communicating a structural problem that has not been addressed.
Conduct scheduled architecture reviews independent of incident response. Post-incident reviews are valuable, but they are inherently backward-looking. Proactive architecture reviews — examining system design against current and projected traffic patterns before incidents occur — create opportunities to identify fragility before it manifests as a 2 a.m. alert.
The Cost of the Loop
There is a real economic argument here that often goes unmade in engineering conversations. Every hour an engineer spends responding to a symptomatic alert is an hour not spent on the architectural work that would eliminate the category of alert entirely. Across a team of five engineers handling dozens of alerts per week, the cumulative opportunity cost is substantial.
For organizations running bulk communication platforms, the stakes are higher still. Delivery failures, queuing delays, and throughput degradation translate directly into undelivered messages, degraded customer experience, and, depending on the use case, missed revenue events. The alert that fires after a bulk notification pipeline degrades is not just an engineering problem — it is a business problem that has already materialized by the time anyone sees it.
The goal of a mature monitoring program is not faster reaction. It is a system designed well enough that fewer reactions are required.
From Ping to Perspective
Ping-based monitoring will always have a role in network health visibility. It is fast, cheap, and directionally informative. But treating it as a complete monitoring strategy is like using a smoke detector as a fire prevention program — it will tell you the house is on fire. It will not tell you the wiring has been degrading for months.
Builders who want to stop chasing alerts need to stop asking "what is broken right now" and start asking "what in our current architecture makes breakage likely." That reframe — from detection to design — is where durable infrastructure actually comes from.
The alerts will still fire. The difference is whether your team is perpetually surprised by them, or already working on the system that makes them obsolete.