Your Network Is Fine. Your Application Is Dying. Here's Why You Can't Tell the Difference.
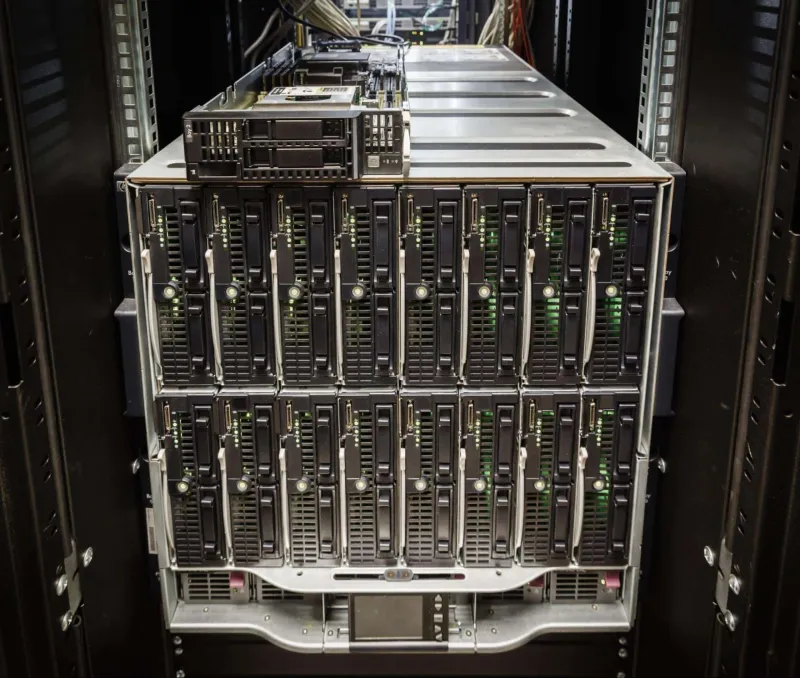
Photo: server monitoring dashboard application performance analytics, via www.fivetk.com
There is a particular kind of outage that does not announce itself. No alerts fire. No dashboards turn red. Your operations team glances at the monitoring console, sees a wall of green, and assumes the world is functioning as intended. Meanwhile, users are staring at loading spinners, failed checkouts, and authentication screens that never resolve.
This is not a hypothetical. It is a recurring failure pattern in production environments across industries — and it stems from a fundamental misunderstanding of what network-level monitoring actually measures.
Ping Is a Proof of Existence, Not a Proof of Function
At its core, a ping test confirms one thing: a host responded to an ICMP echo request. That is a meaningful signal, but it is an extraordinarily narrow one. It confirms the machine is powered on and reachable at the network layer. It says nothing about whether the web server process is running, whether the database connection pool has been exhausted, whether the application's authentication service is returning 500 errors, or whether a downstream API dependency has quietly started timing out.
Think of it this way: pinging a restaurant's phone line and hearing a dial tone does not tell you whether the kitchen is operational, the staff showed up, or the menu items you want are actually available. The connection exists. The experience may be entirely broken.
For builders running bulk communication infrastructure — notification pipelines, mass messaging platforms, API-driven alert systems — this distinction is not academic. It is the difference between knowing your system is delivering and merely knowing your servers are breathing.
The Application Layer Is Where Users Actually Live
The OSI model is a useful mental framework, and network monitoring tools tend to operate at layers three and four: IP routing and TCP connectivity. But users experience your system at layer seven — the application layer. That is where HTTP responses are generated, where business logic executes, where session tokens are validated, and where the actual payload of your service is produced and delivered.
Application-layer failures are often invisible to network monitoring precisely because the underlying transport is functioning correctly. A web server can accept a TCP connection, receive an HTTP request, and return a 200 OK status code — all of which satisfies a basic health check — while simultaneously returning an empty response body, a cached error page, or corrupted data. The network probe sees success. The user sees failure.
This gap widens considerably under load. During high-traffic periods, connection queues fill, worker threads block, and memory pressure causes garbage collection pauses that stretch response times from milliseconds into seconds. A ping will still complete in under five milliseconds. Your actual API endpoint may be taking twelve seconds to respond — or not responding at all before the client times out.
Real Failure Scenarios From Production Systems
Consider a bulk notification platform that sends transactional alerts to hundreds of thousands of users. The delivery pipeline depends on a message queue, a worker service, a database for recipient records, and a third-party SMTP gateway. Network monitoring confirms all four hosts are reachable. What it cannot confirm:
- The message queue has filled beyond its configured memory limit and is silently dropping new entries
- The worker service is running but has entered a deadlock state and is processing zero messages per second
- The database is accepting connections but returning query timeouts due to a missing index on a recently migrated table
- The SMTP gateway is accepting submissions but has internally throttled delivery due to a reputation flag on the sending IP range
In each case, the infrastructure is technically online. The service is functionally offline. Users receive no notifications. The business absorbs the cost — in lost engagement, failed transactions, or compliance violations — while the monitoring system reports a clean bill of health.
This is what practitioners sometimes call the "green dashboard paradox": the more your monitoring focuses on connectivity, the more confident you become in systems that may be silently degrading.
What Application-Layer Monitoring Actually Requires
Closing the gap between network health and service health requires a deliberate shift in measurement strategy. The following approaches are not exotic — they are increasingly considered baseline practice for any team operating services at meaningful scale.
Synthetic transaction monitoring involves executing scripted end-to-end workflows against your production or staging environment at regular intervals. Rather than asking "is this host reachable?", you ask "can a user successfully complete this specific action?" For a bulk messaging platform, that might mean verifying that an API call to enqueue a message results in a confirmed delivery event within an expected time window.
Application performance monitoring (APM) instruments the internals of your application processes, capturing response times, error rates, database query durations, and dependency call latency at a granular level. This visibility exposes the slow degradations that precede outright failures — the kind of early warning that pure network monitoring cannot provide.
Health check endpoints with semantic depth go beyond returning a static 200 OK. A well-designed health check validates that the application can actually perform its core function: it tests a database read, confirms queue connectivity, and verifies that critical configuration values are present. An endpoint that checks all of these before responding gives your monitoring system something meaningful to evaluate.
Error rate and latency thresholds as primary alerts shift the alerting philosophy from "is the host up?" to "is the service behaving within acceptable parameters?" A sudden increase in 5xx responses or a p95 latency spike should trigger investigation before users begin reporting problems.
The Monitoring Stack Deserves the Same Engineering Rigor as the Product
One reason teams default to ping-based monitoring is simplicity. It is fast to configure, cheap to operate, and produces a clean, legible signal. Application-layer monitoring requires more investment: instrumentation work, threshold calibration, and ongoing maintenance as the application evolves.
But the cost of that investment is dwarfed by the cost of the failures it prevents. For any organization running bulk communication infrastructure — where delivery guarantees, SLA commitments, and user trust are central to the value proposition — the question is not whether to invest in deeper monitoring. It is how quickly that investment can be made operational.
A network that responds to pings is not a service that works. Until your monitoring stack can tell the difference, you are operating with a fundamental blind spot — one that will eventually cost more than the instrumentation you chose not to build.
The ping confirms the road exists. Application-layer monitoring tells you whether the traffic is actually moving.